Comparisons have been made between different classifier programs using the available versions at the time. Throughout the years, these comparisons have shown a consistent trend: no classifiers based on zero-crossing recordings have exceeded SonoBat’s full spectrum based classification performance. This suggests that full spectrum data analysis leads to a high percentage of your files that are classified and a high percentage that emerge correct. Below are a few snapshot comparisons of real projects . . .
Indiana Bat Survey, Illinois & Missouri

Known Bat Call Collection from the Western US

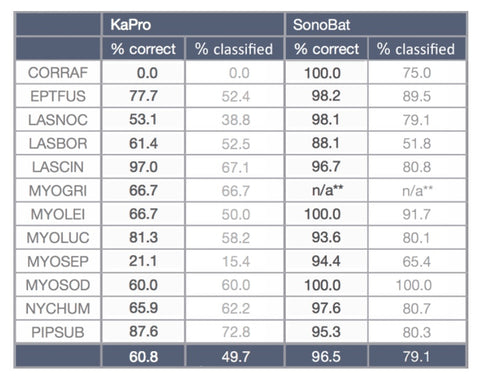
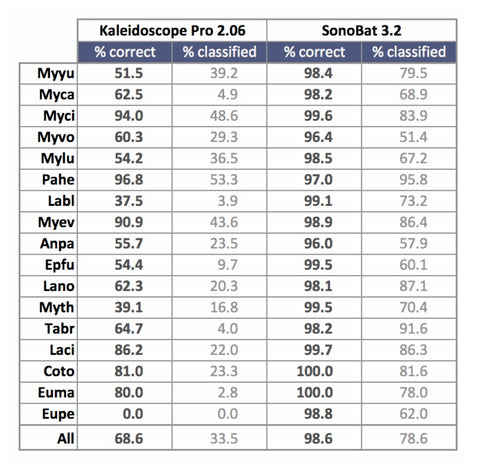
Comparative classification performance of Kaleidoscope and SonoBat on 5224 good quality species- known recordings collected and processed by T. Malloy of Stanford Jasper Ridge Biological Preserve in California (2014). The "% classified" column indicates the percentage of known recordings given a decision, and the "% correct" column indicates the rate of correct classification of those outputted with a decision. SonoBat more often was correct with -every- species.
Florida Bonneted Bat • Florida
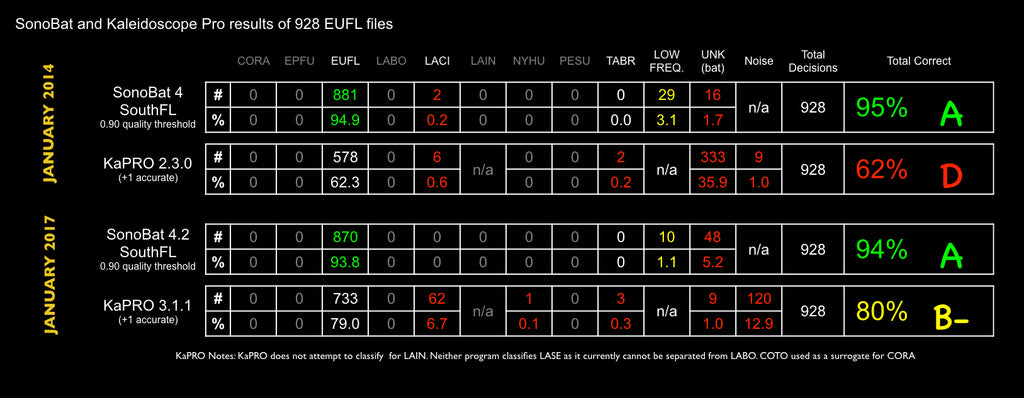
 Results of 928 manually-confirmed Florida Bonneted Bat files when analyzed by 2014 and 2017 versions of SonoBat and KaPRO, demonstrating while the ZC-based KaPRO has improved, it has not surpassed FS-based SonoBat in this test.
Columbus Park • Arizona

Summary of four SonoBatLIVE units that collected 1,607 files on the last night of the International Acoustic Symposium in Tucson, AZ in March 2017. Chris Corben spotlighted myotis and identified them all as Myotis velifer using his experience as a guide and without using auto-ID software. SonoBatLIVE auto classified almost all the myotis as Myotis velifer. Other results included 753 Tabr accepted and not a single call was misclassified as Laci. The Laxa and Pahe presence was confirmed by manual vetting. SonoBatLIVE most closely returned results predicted by the 3rd party expert, as well as correctly teased out 3 other species.
Yolo Roost • California
 Summary of 1,821 auto-classified files recorded near, but not next to, a colony of bats in September 2014. The actual dataset has been manually reviewed and a majority were identified as Tabr but there were also 3 Laci and 8 Myotis that were correctly Identified by SonoBat. In addition, manual vetting of the 9 Lano files identified by SonoBat revealed them as Tabr files, but SonoBat's probabilistic algorithms calculated an MLE rejecting presence. KaPRO failed to classify 2.5x more files than SonoBat. Of the files that were classified, 10% of the Tabr were incorrectly identified as Lano, 20% were incorrectly classified as EPFU, and neither species were actually present in the dataset. When only considering the MLE values, SonoBat more closey reflects the true dataset with one species present, two likely, and one possible. KaPRO reports 6 species present and one possible.
SonoBatLIVE vs. Echometer Touch • Mt. Lemmon, Arizona
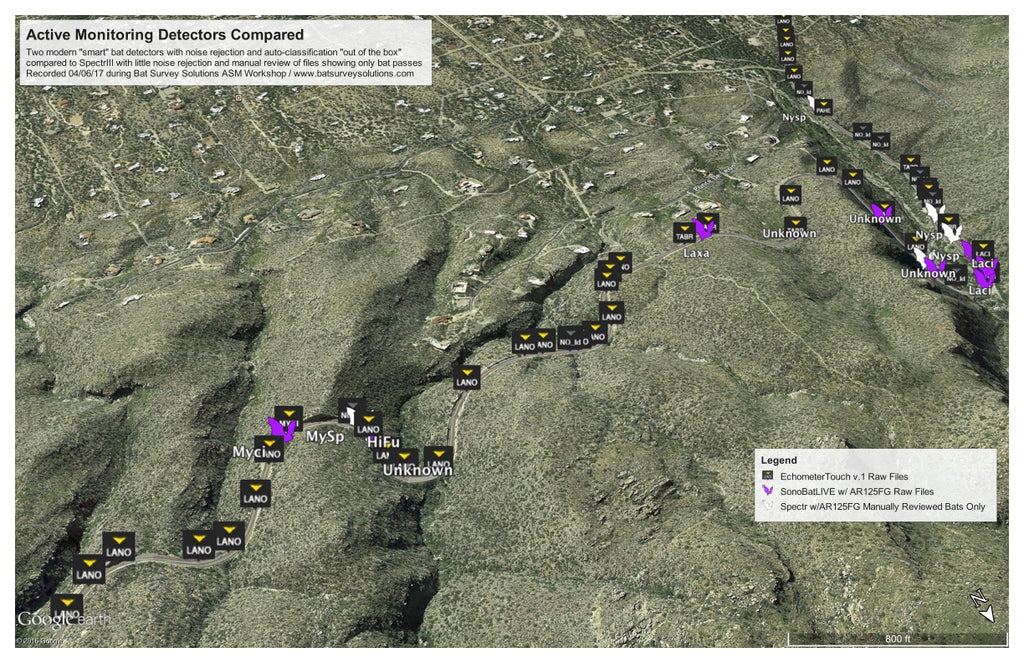
 An Echometer Touch 1 microphone and twin BAT AR125FG microphones were all mounted within inches of each other on a mobile transect during Bat Survey Solutions Acoustic Survey Methods Workshop in April 2017. The screenshot above illustrates white markers recorded with one 125FG and Spectr III app with no noise rejection system, then painstakingly manually reviewed to remove the extra noise files, leaving only a few actual bat files. This may be then considered the standard to which the other systems compare to. SonoBat's robust noise rejection system allowed mostly bats to pass and relatively few extra noise files, if any. The Echometer Touch accepted an overwhelming number of noise files which also classified (falsely) as bat calls. Ideally all three systems would show roughtly their markers in approximately the same location meaning all systems record the same bat passes at the same times, however this is rarely the case with bat acoustic monitoring. Trials like this are necessary to to gain confidence in new noise rejection and species classification algorithms, in this case SonoBatLIVE performed exceedingly well saving hours of tedious manual post processing work.


