Top Recommendation for Bat Call Analysis
BCM's Top Recommendation for Bat Call Analysis: SonoBat 4
The scientific community agrees with what Bat Survey Solutions and BCM has been teaching at workshops for years:
Manual validation of an auto-classifier software's unvalidated output is indispensable for reasonable occupancy results from passive acoustic surveys.
– Fritsch, G., & Bruckner, A. (2014). Operator bias in software-aided bat call identification. Ecology and Evolution. 4(13) 270-2713.
And there is just one software program on the market today that combines all the essential information for manual vetting in one window for optimal efficiency during the analysis process: SonoBat!
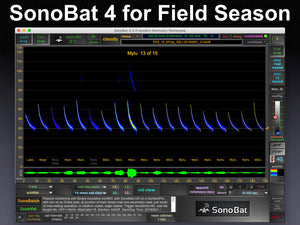
SonoBat software is the most feature-rich display and analysis tool we have tested that is specifically designed to analyze bat call data, and also provides species suggestions. It is the only software that makes use of the complete full-spectrum content of the echolocation recordings, and includes essential utilities for managing data and organizing monitoring efforts. And, it provides users with both qualitative and quantitative analysis tools for auto-generating species identification decisions, which makes any reporting, analysis and occupancy decisions based on acoustic data far more robust and reliable.
- Over a dozen Full-spectrum measures calculated from any user-selected call pulse in a sequence
- Over 120 full-spectrum measures calculated from each pulse which contribute to species decision making
- Standard-view window to view call pulses at fixed proportions, optimizing qualitative analysis
- Split-screen option to compare unknown call-pulses to an on board library of over 1,200 voucher calls
- Integrated meta-data text note to describe deployment details for every recording in the data set
- Audio-output options to listen to the real-time or 10x time-expanded call sequence
- Standard filters to remove non-bat noise in a file to boost spectrographic quality for decision-making
- Single-button calculation for the most precise & accurate pulse-level & sequence-level ID’s of any software today
What about accuracy?
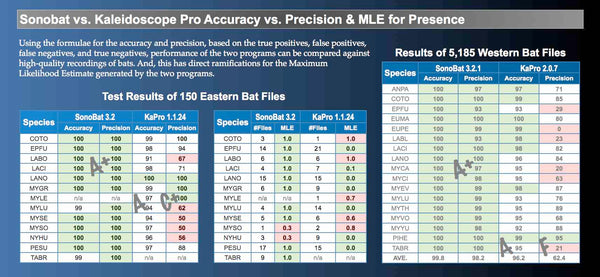
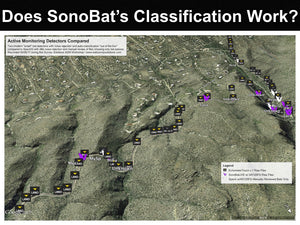
What does this mean in real surveys? According to this test data, the Northern long ear bat (Myotis septentrionalis) can have a 50% error rate when using Kaleidoscope Pro (KaPro), and have other species assigned to MYSE. As a species of special concern in the process of being reviewed for federal protection listing, this could have significant ramifications on land management if KaPro's data is to be accepted without expert manual review. BCM has independently tested Kaleidoscope Pro, BCID, and Echoclass against our own expertly vetted files and have determined SonoBat provides the most accurate results of raw autoclassifer data. For more information on how we arrive at accuracy and precision figures, please see the poster below . . .
Assessing Classifier Accuracy - Kaleidoscope Pro vs. SonoBat

Kaleidoscope Pro vs. SonoBat Expertly Vetted Missouri Dataset
Comparative classification performance of Kaleidoscope and SonoBat on 7115 good quality species-known recordings collected and processed by Janet Tyburec in Missouri (2012). "% classified" indicates the percentage of known recordings given a decision, and "% correct" indicates the rate of correct classification of those outputted with a decision.
** The SonoBat classifier used for this study did not include the gray bat (MYOGRI). In other tests, SonoBat has classified 90.3% of MYOGRI recordings with 100% correct.
Kaleidoscope Pro vs. SonoBat Expertly Vetted Western Dataset
Malloy 2014
Comparative classification performance of Kaleidoscope and SonoBat on 5224 good quality species-known recordings collected and processed by T. Malloy of Stanford Jasper Ridge Biological Preserve in California (2014). "% classified" indicates the percentage of known recordings given a decision, and "% correct" indicates the rate of correct classification of those outputted with a decision.
Kaleidoscope Pro vs. SonoBat FL Expertly Vetted Florida Bonneted Bat Dataset
Chenger/Tyburec 2015

This table shows what happens when you throw 928 EUFL files at the two most advanced commercial classifiers available today. Each program contains proprietary quality control checks that must be passed before an attempt is made to render a species decision on any file. The default settings with each program are arbitrary and so it would be difficult to compare the results of any one single test. Therefore, two tests were done using each program set to two extremes of quality thresholds, one being relatively conservative in making species decisions and another that is liberal.
Results: There is not much difference between the SonoBat results (95% and 97% correctly identified). SonoBat's more conservative setting provided a higher ID success rate than KaPRO's most liberal setting (94.9% vs. 80.7%). As this is a rare species, it may occur in small numbers or infrequently in places, so there may be an advantage to successfully outputting correct EUFL decisions on 95% v. 62% or 97% v. 81% in other situations where there is a smaller dataset than a batch of 928 files. The biggest difference between the programs is in how many files each leaves on the table without classifying. At the more liberal settings, KaPRO did not classify a total of 168 files to SonoBat's 15. There was almost no difference in unknown classifications for SonoBat at either setting, suggesting a real benefit to SonoBat's use of analyzing the available full spectrum content as opposed to KaPRO's zero crossing analysis method which relies on only a fraction of the available signal content.
Also of note is the Low Frequency category that SonoBat provides. Assuming EUFL was the species of interest, experienced researchers will manually review those the Low Frequency-classed files and in this case find even more EUFL. While not a directly successful classification by SonoBat, this is something to consider when thinking about what software has tools/features that would ultimately lead the researcher to finding more species of interest.
More Accuracy & Precision Data from . . . Wildlife Acoustics
At this time, very little has been written on the accuracy of various software programs, no doubt due to the daunting task of acquiring a large enough, professionally vetted dataset to run, not to mention the time investment in organizing the data and results. In the interest of presenting a wider range of data sources, we have this table adapted from a larger spreadsheet available from Wildlife Acoustics in which they tested Kaleidoscope Pro against their own training data, and created confusion tables similar to the poster above. (At the request of Wildlife Acoustics, BCM is no longer permitted to provide colleagues with direct links to anything on Wildlife Acoustic's website, so from the Wildlife Acoustics home page, select Products>Kalideoscope Software>Available Bat Classifiers>Download Kaleidoscope Classifier Performance Excel Chart, or see the link contained in message 2 of this Linkedin thread) We have provided our explanatory text below.
Our analysis: From Wildlife Acoustic's published data, there is a very poor accuracy and precision record for the Kaleidoscope Pro 2.2.0 classifier (December 2014). In the spreadsheet available, there are two tabs, one for North American species and one for UK species. Each contains three "confusion" tables, one for each of the Kaleidoscope settings (i.e., more accurate, more sensitive, and "balanced" - there appears to be little difference between the settings and therefore we will highlight the default "balanced" setting). There is a rather poor true-positive rate and a rather large number of false-positives and false-negatives in the table. We've highlighted the results to make this more obvious. Light red highlights are for what we consider to be D-grade results, e.g., less than 70% performance. Dark red highlights are results with a performance of ~50% or less, that is, no better than the flip of a coin. Over half the species (13 out of 25) in this classifier receive D-grade or below classification performance. Wildlife Acoustics also calculates a % Correct rate, and 7 of the 25 species (from Wildlife Acoustics training data) have % correct rates of 79% or less, with 3 of these less than 60%. Finally, we draw your attention to the NoID column . . . of the ~400 MYOSEP files (from developers's ~training~ data) that were thrown at the classifier, over 2/3rds received NoID. This is unfortunate for a soon-to-be listed species that will be of intense interest to document via acoustic means. Using Kaleidoscope Pro for MYOSEP surveys will significantly bias results by simply not identifying a vast majority of MYOSEP recordings.
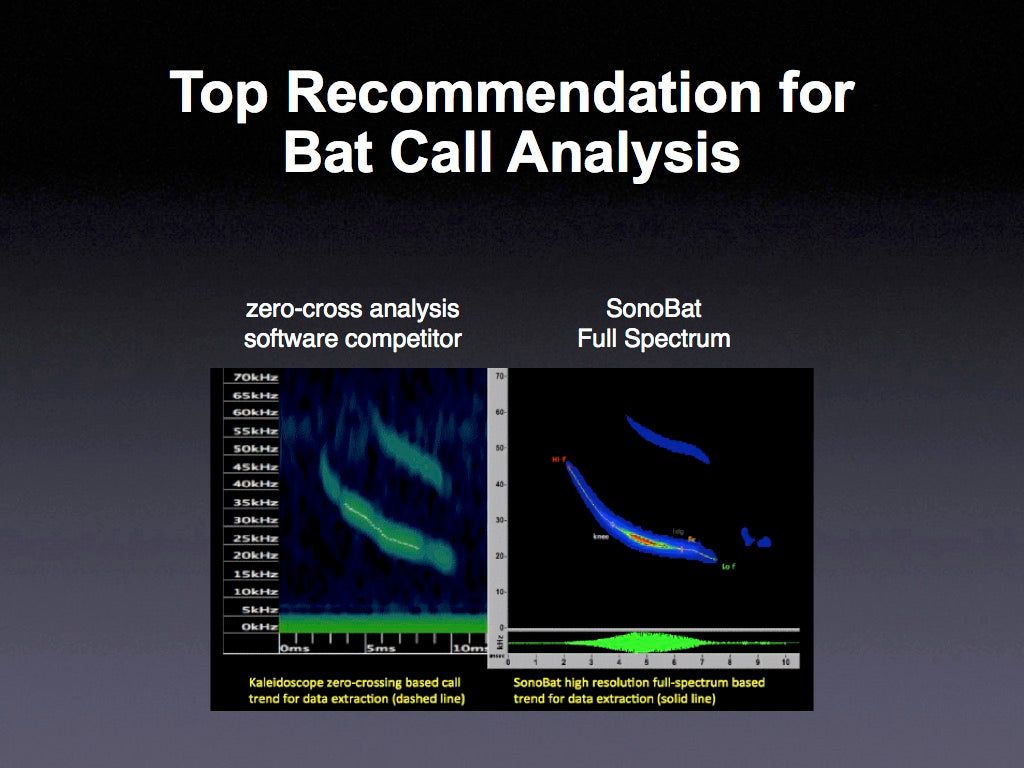
Although some other classifiers such as Kaleidoscope accept full-spectrum signals, they extract data from calls using zero-crossing analysis. Although fast, it lacks fine scale resolution and cannot track call data as robustly through noise, or when signals become weaker from bats at distance. Using the significantly richer information content of full-spectrum data enables tracking call signal trends when weaker than ambient sound and discriminating call content from noise and echoes. In contrast, SonoBat takes advantage of this full information content for more precise analysis and data integrity.
Below, the same silver-haired bat call processed in Kaleidoscope Pro (left) and SonoBat (right) showing the trend lines used to acquire the data used in classification of the calls. SonoBat uses the complete information content inherent in full-spectrum data to track call signal content using an intelligent tracking algorithm. This provides more robustness and accuracy on which to base species classifications.

As researchers ourselves, we hope to see more products that will put genuinely useful, scientifically defensible tools in the hands of researchers, bat biologists and resource managers. We diligently test the products available, provide feedback to the developers, and will continue to do so as new developments arise. In the current landscape of automated acoustic classifiers with manual analysis tools, SonoBat continues to hold its place as the only software with the rigor, track record and integrity required for robust scientific and resource management applications.
- John Chenger